Some commonly asked questions
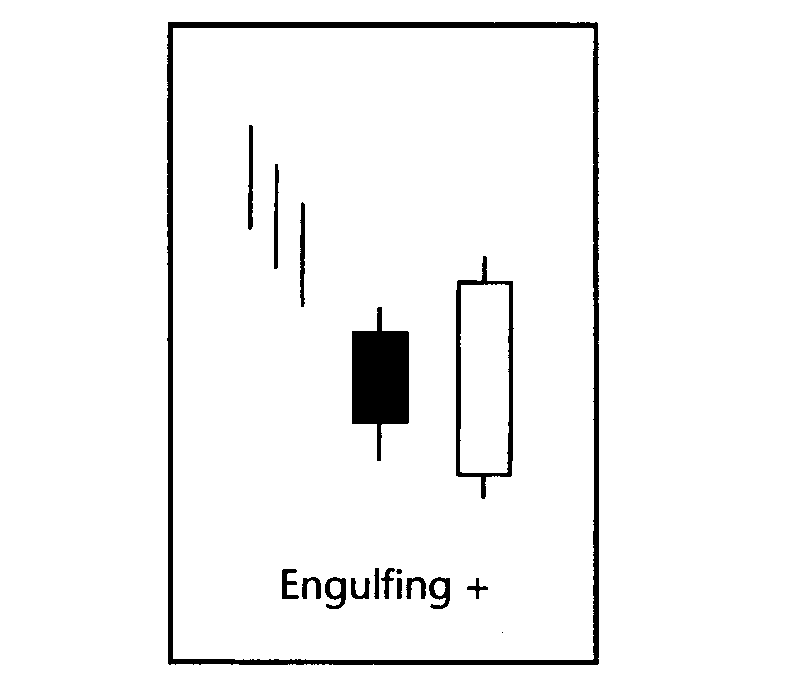
Engulfing Bullish Reversal
- Stock should be in a downward trend
- Large white candlestick today
- Small red candlestick yesterday
- Today's candlestick completely engulfs the body of yesterday
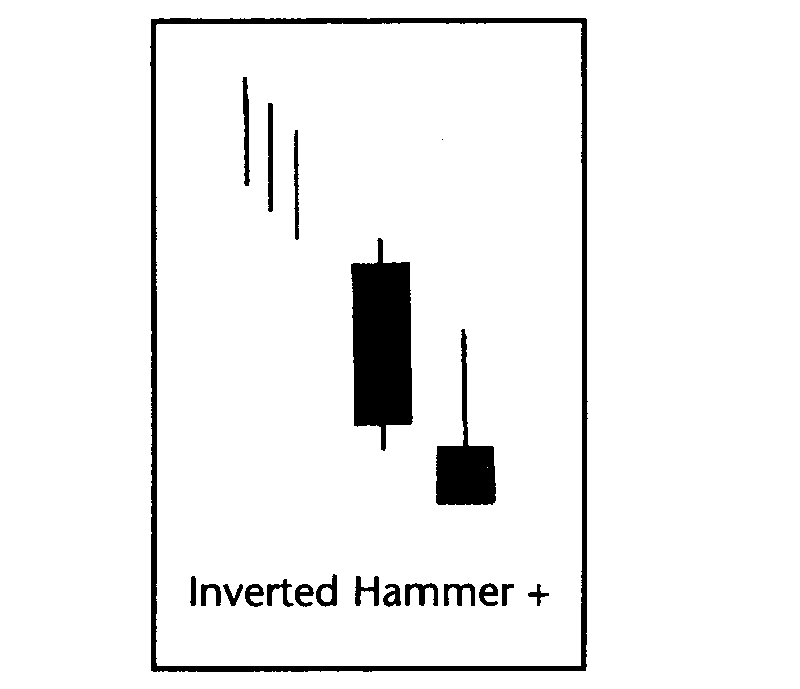
Inverted Hammer Bullish
- Stock should be in a downward trend
- Large upper shadow or wick today
- Yesterday is a dark candlestick
- Today's open below or at the level of the yesterday's close
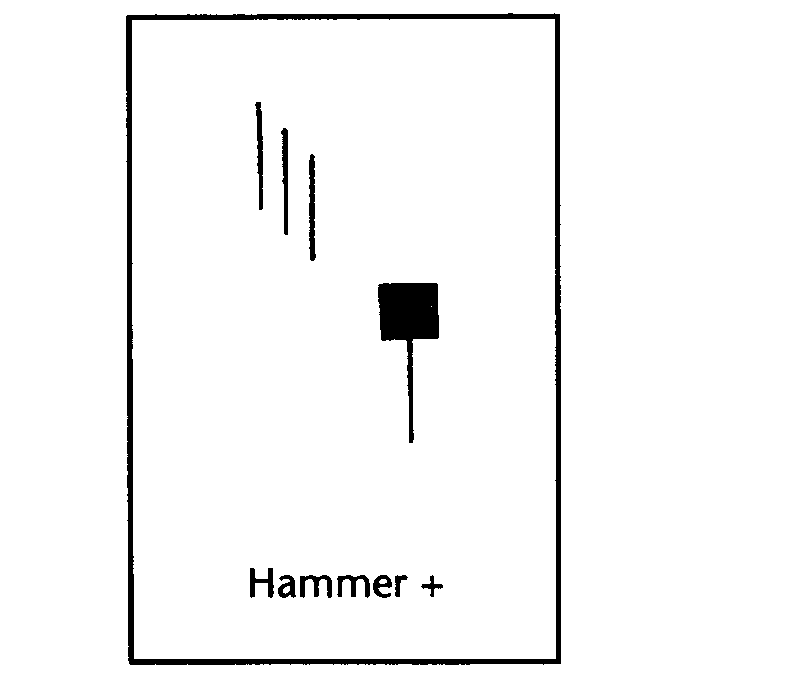
Hammer Bullish
- Stock should be in a downward trend
- Large lower shadow or wick today
- Open and high of today are the same
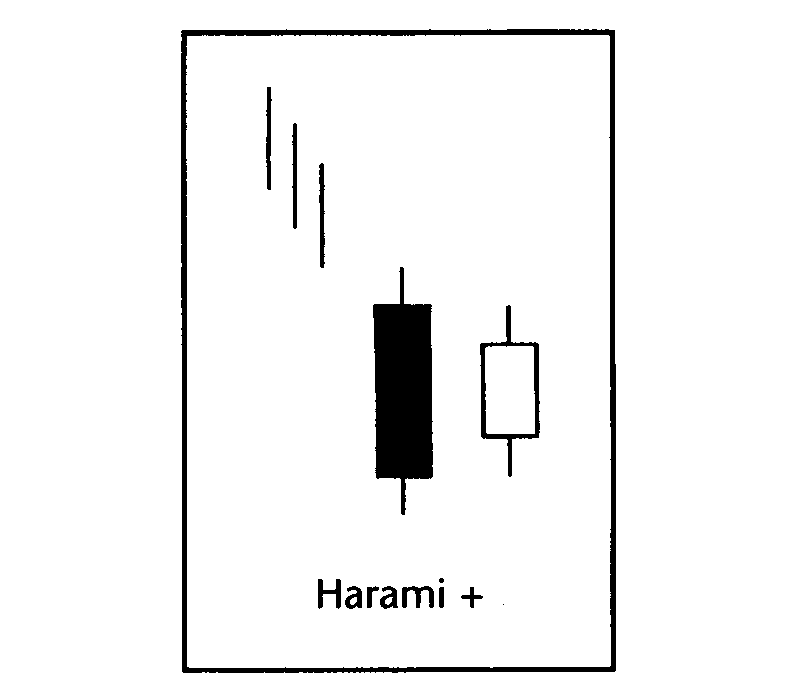
Harami Bullish
- Stock should be in a downward trend
- Today is small white candlestick
- Yesterday is a long dark candlestick
- Body of today's candlestick is engulfed by body of yesterday's candlestick
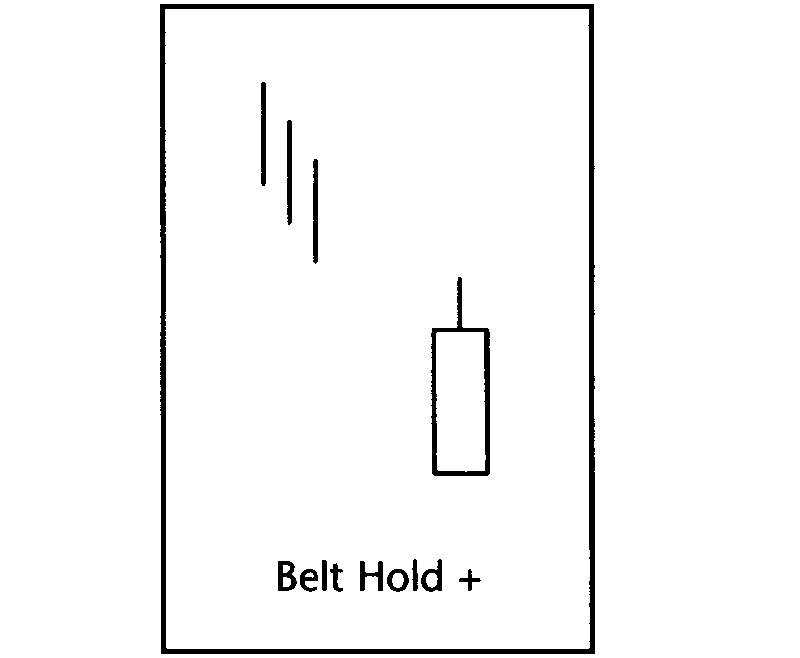
Belt Hold Bullish (Low Reliability)
- Stock should be in a downward trend
- Today is a long white candlestick
- Opening price today is also the low of the day
- Small upper wick
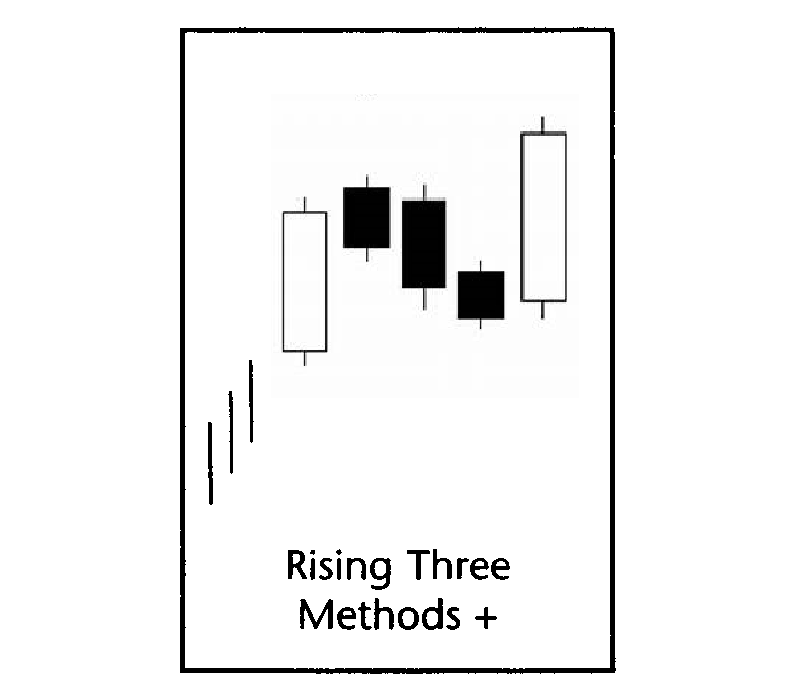
Rising Three Methods Bullish
- Five day pattern where today is Day 5
- Stock should be a upward trend
- Day 1 is a long white candlestick
- Day 2, Day 3 and Day 4 are dark candlesticks trading within high and low of day candlestick
- Today or Day 5 is a long white candlestick that close higher then Day 1
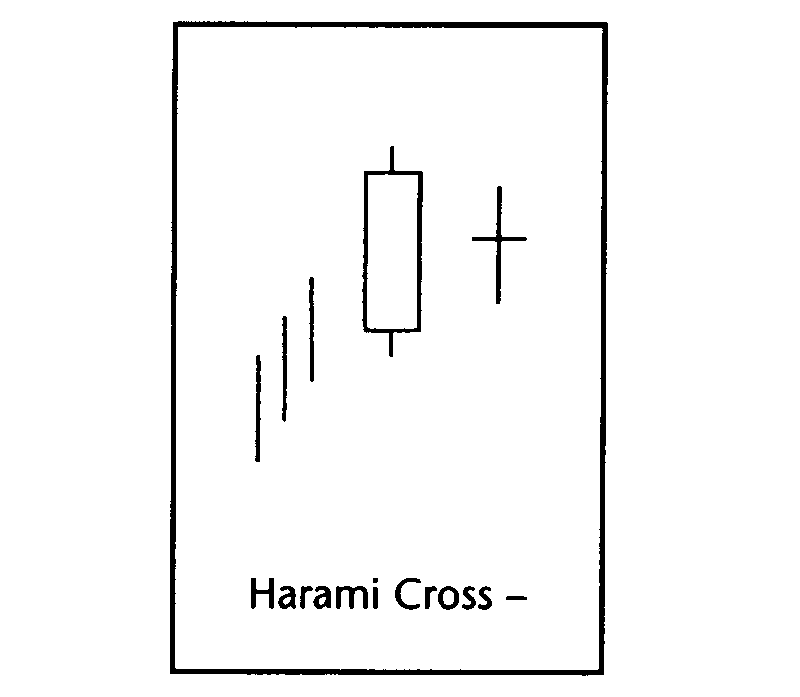
Harami Cross Bearish
- Stock should be in a upward trend
- Yesterday is a long white candlestick
- Today is a Doji. Open and close are the same
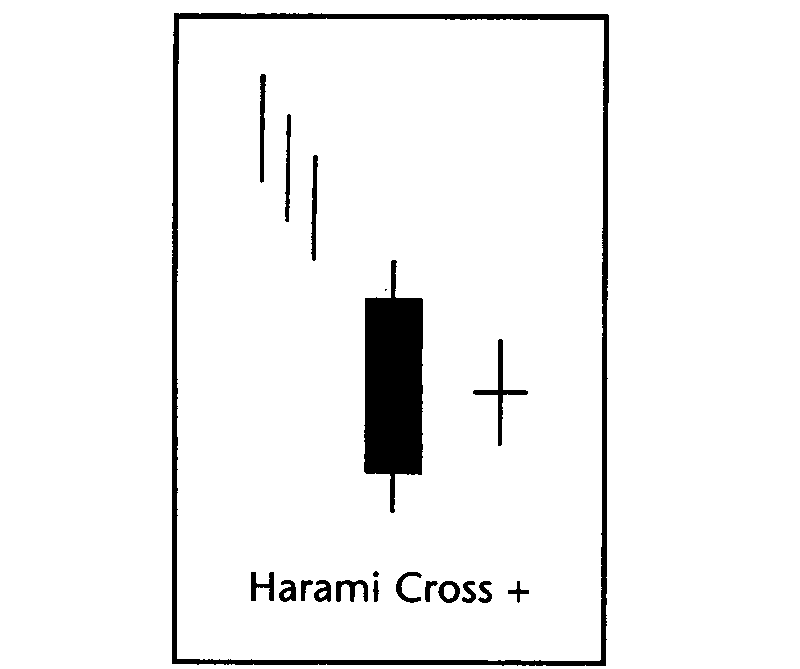
Harami Cross Bullish
- Stock should be in a downward trend
- Yesterday is a long dark candlestick
- Today is a Doji. Open and close are the same
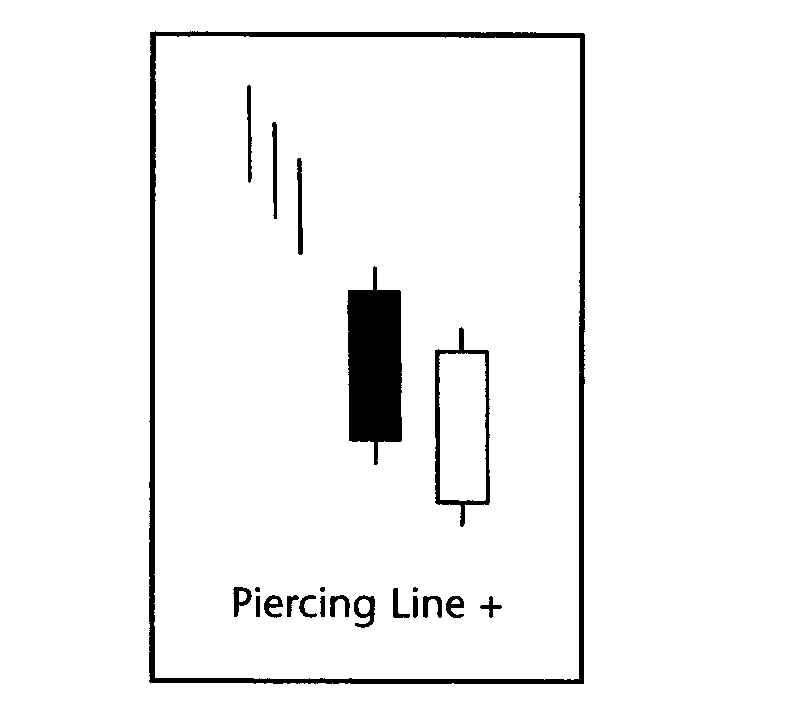
Piercing Line Bullish
- Stock should be in a downward trend
- Yesterday is a long dark candlestick
- Today is a long white candlestick
- Today close is equal or above the mid point of yesterday's open and close
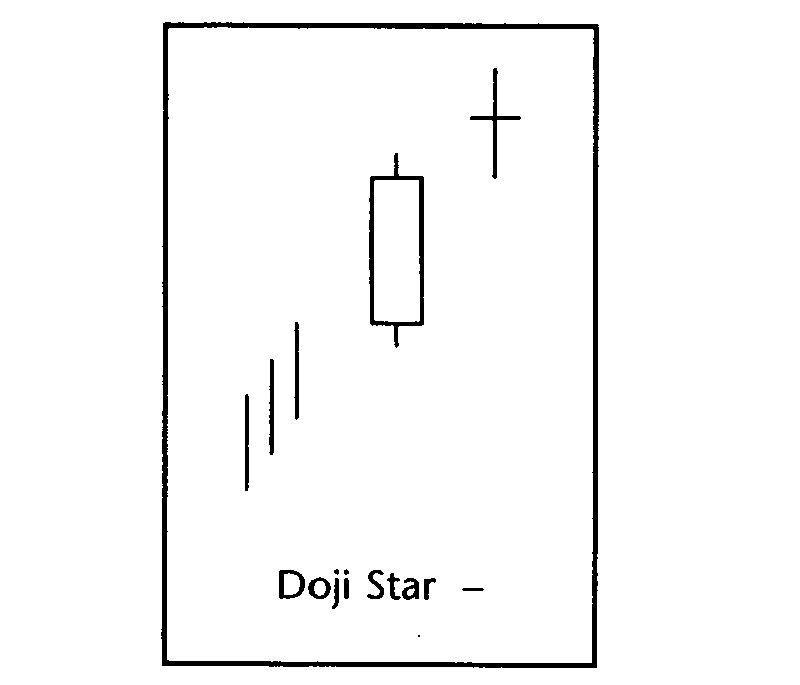
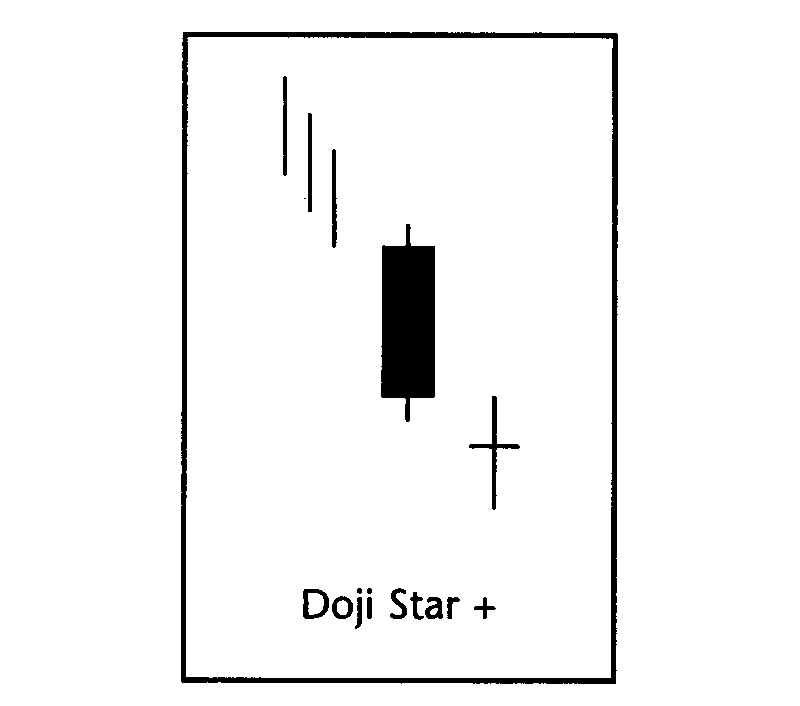
Doji Star Bullish
- Stock should be in a downward trend
- Yesterday is a long dark candlestick
- Today is a Doji star (Today open and close are the same)
- Today's open is near or equal to yesterday's close
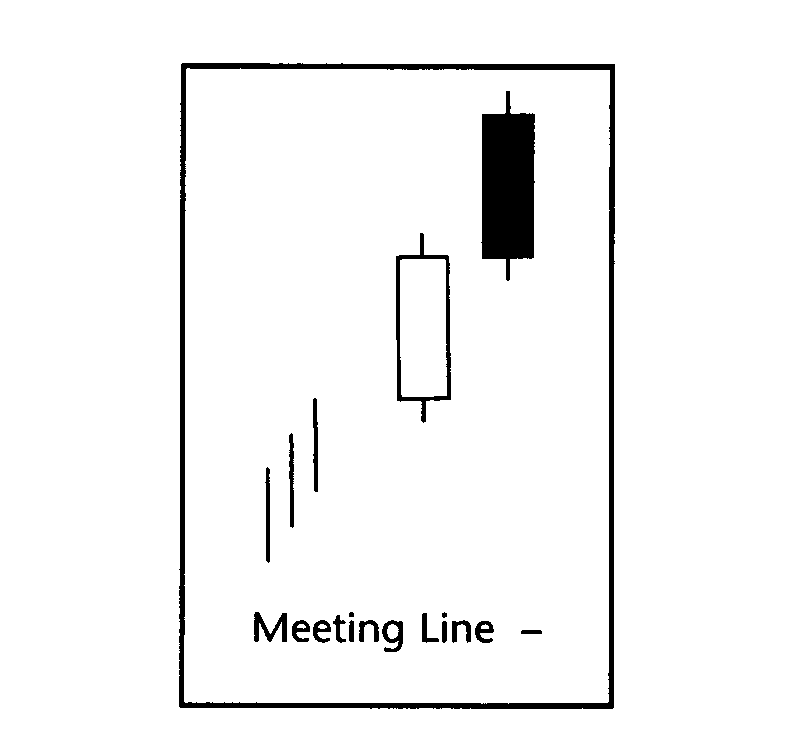
Meeting Lines Bearish
- Stock should be in a upward trend
- Yesterday is a long white candlestick
- Today is a long dark candlestick
- Today's open is higher than yesterday's close
- Today's close is equal to yesterday's close
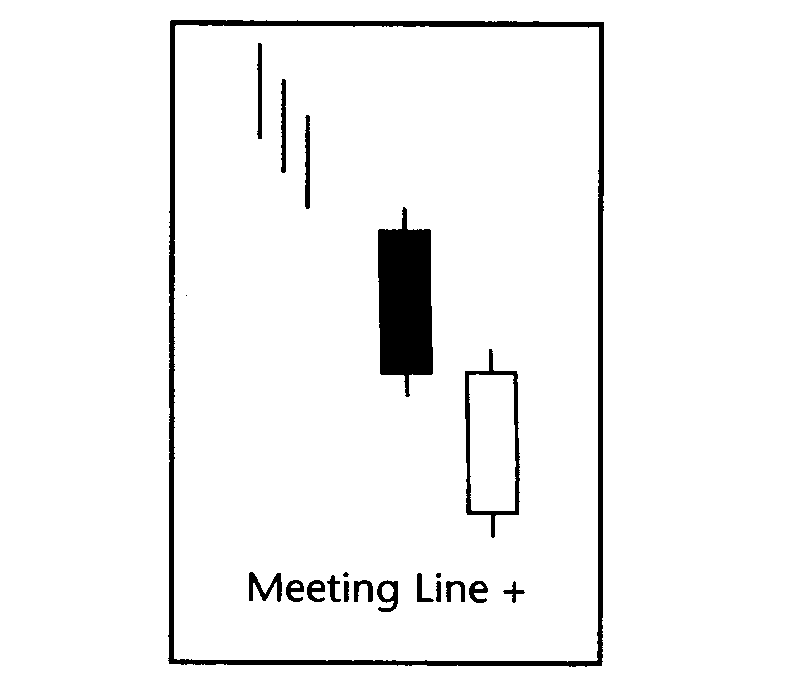
Meeting Lines Bullish
- Stock should be in a downward trend
- Yesterday is a long dark candlestick
- Today is a long white candlestick
- Today's open is lower than yesterday's close
- Today's close is equal to yesterday's close
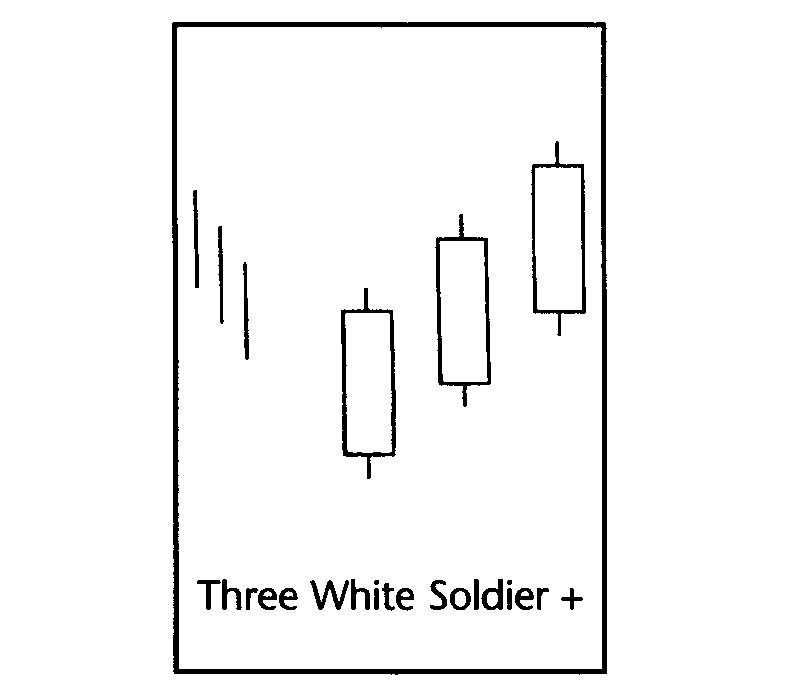
Three White Soldiers Bullish
- Stock should be in a downward trend
- Three consecutive days of long white candlesticks
- Each day the open should be within open and close of the previous day
- Every day the close is above the close of the day before
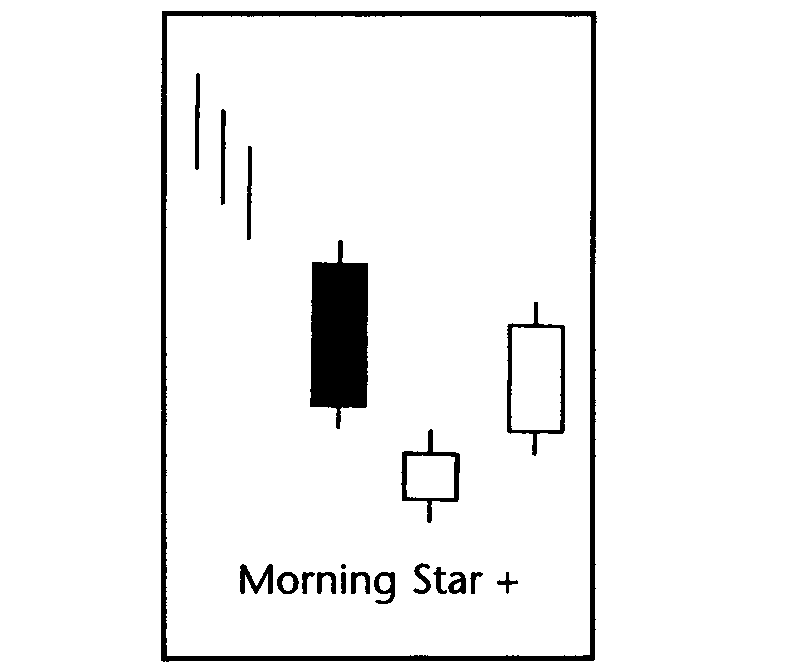
Morning Star Bullish
- Stock should be in a downward trend
- Three day trend where today is day 3
- First day is a long dark candlestick
- Day 2 or yesterday is a small dark or white candlestick that closes below day 1 close
- Day 3 or today is a long white candlestick that opens above yesterday's high and closes near the middle of day 1 candlestick
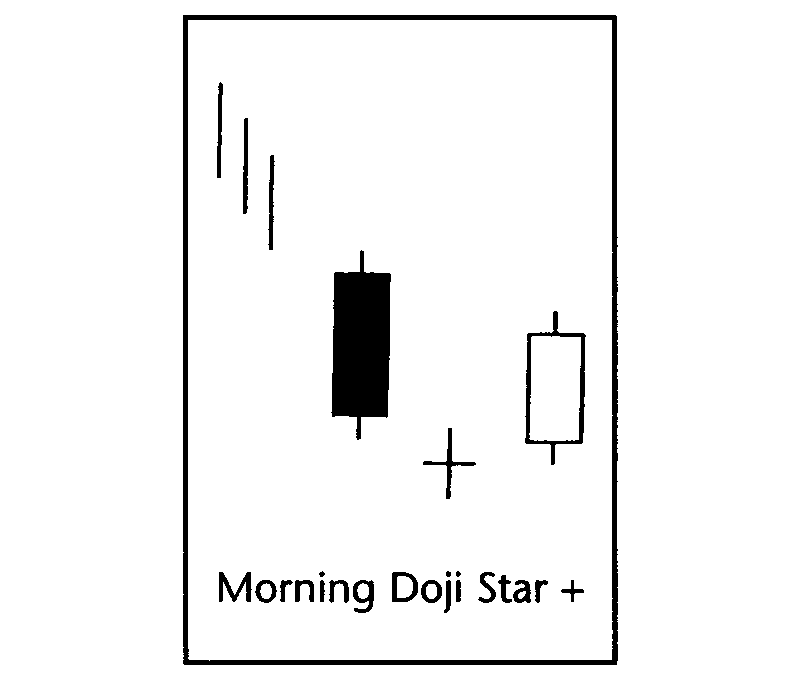
Morning Doji Star Bullish
- Stock should be in a downward trend
- Three day trend where today is day 3
- First day is a long dark candlestick
- Day 2 or yesterday is a Doji star where open and close are equal.
- Day 2 or yesterday closes below day 1
- Day 3 or today is a long white candlestick that opens above yesterday's high and closes near the open of day 1 candlestick
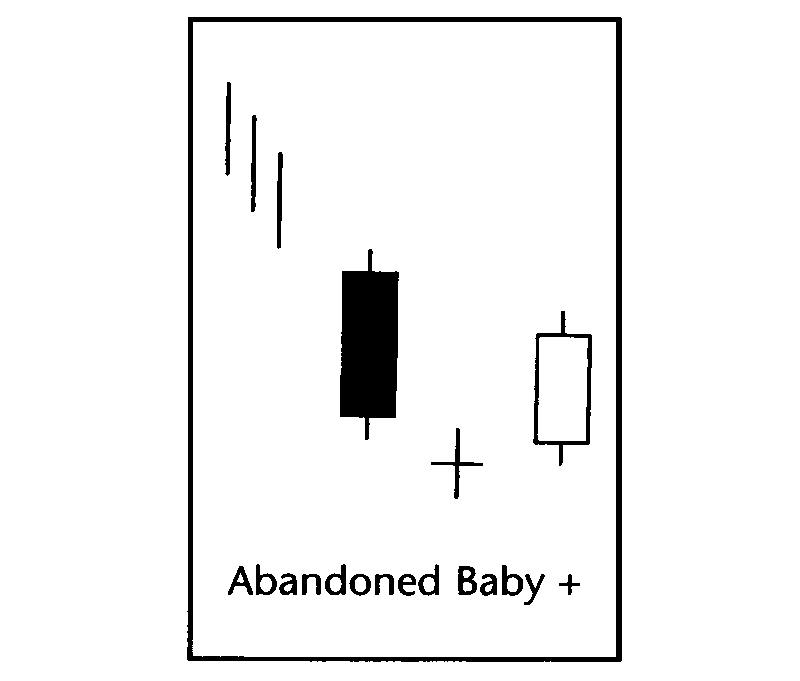
Abandoned Baby Bullish
- Stock should be in a downward trend
- Three day trend where today is day 3
- First day is a long dark candlestick
- Day 2 or yesterday is a Doji star where open and close are equal
- Day 2 or yesterday opens below Day 1 low and closes below day 1
- Day 3 or today is a long white candlestick that opens above yesterday's high and closes near the open of day 1 candlestick
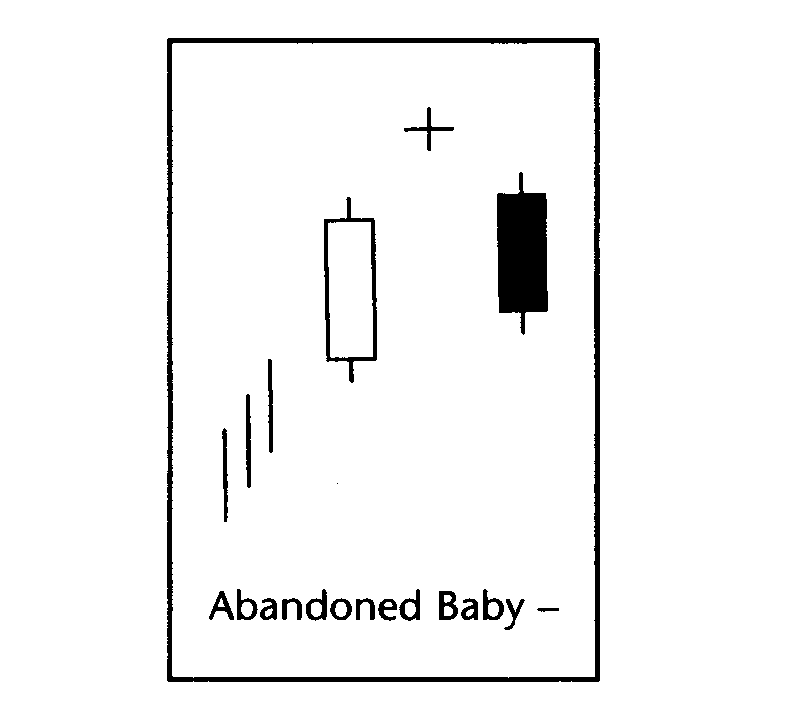
Abandoned Baby Bearish
- Stock should in a upward trend
- Three day trend where today is day 3
- First day is a long white candlestick
- Day 2 or yesterday is a Doji star where open and close are equal
- Day 2 or yesterday opens above Day 1 high and closes above Day 1
- Day 3 or today is a long dark candlestick that opens below yesterday's low and closes near the close of day 1 candlestick
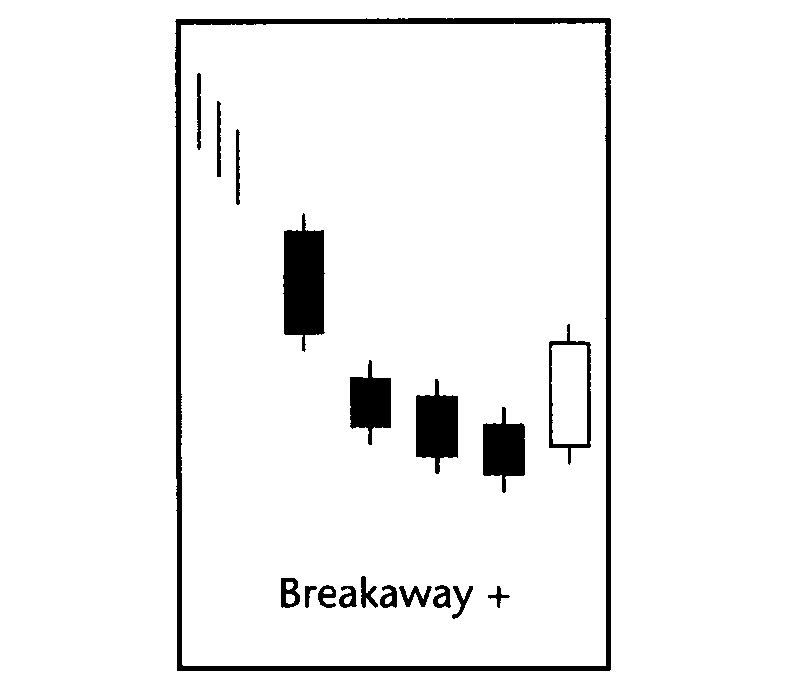
Breakaway Bullish
- Stock should be in a downward trend
- Five day pattern where today is day 5
- Day 1 is a long dark candlestick
- Day 2, 3, & 4 are dark candlesticks where each day closes below the previous day's close
- Day 5 or today is a long white candlestick where the close is within Day 1 open and close
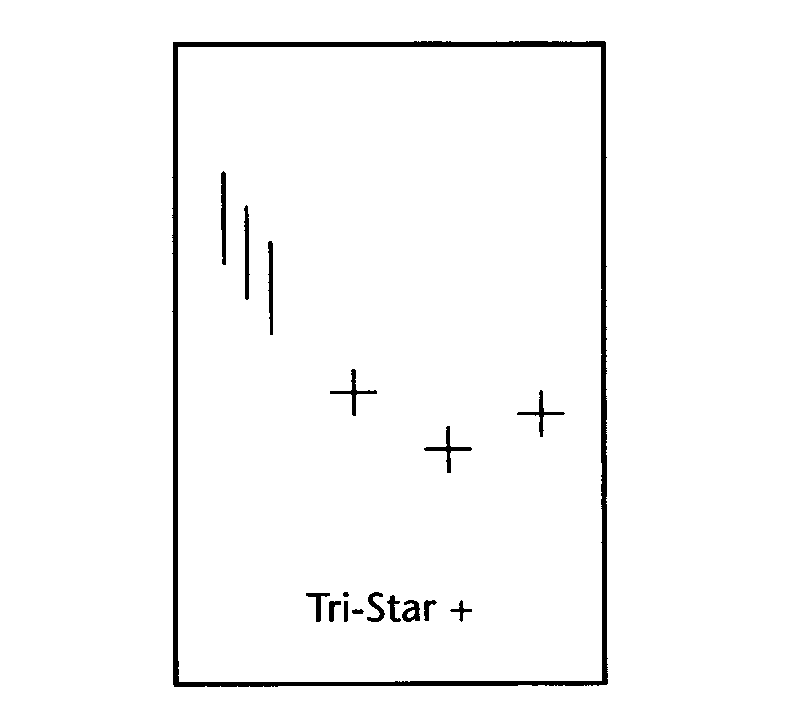
Tri Star Bullish
- Stock should be in a downward trend
- Three day pattern where today is day 3
- Three consecutive days of Doji star where open and close are the same
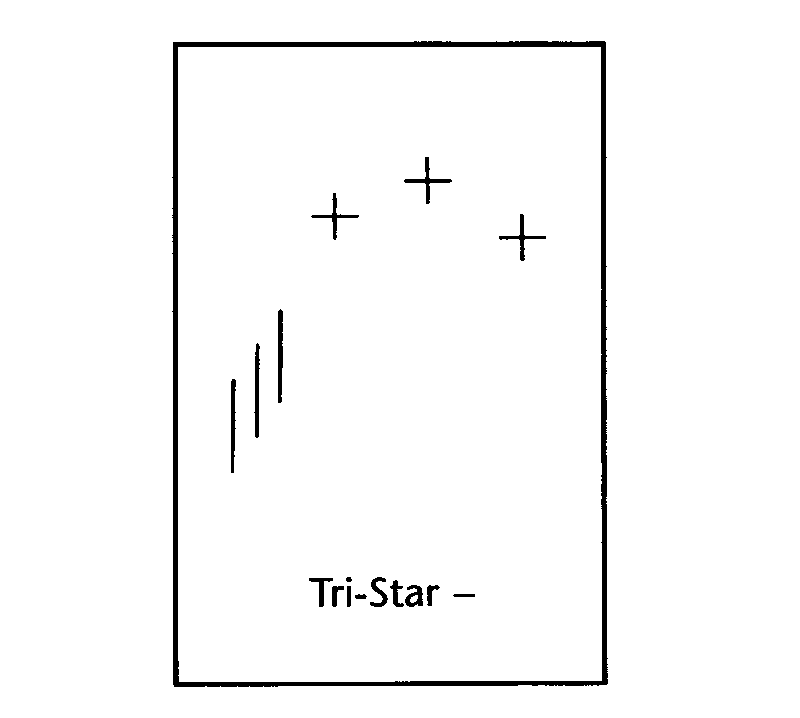
Tri Star Bearish
- Stock should be in a upward trend
- Three day pattern where today is day 3
- Three consecutive days of Doji star where open and close are the same
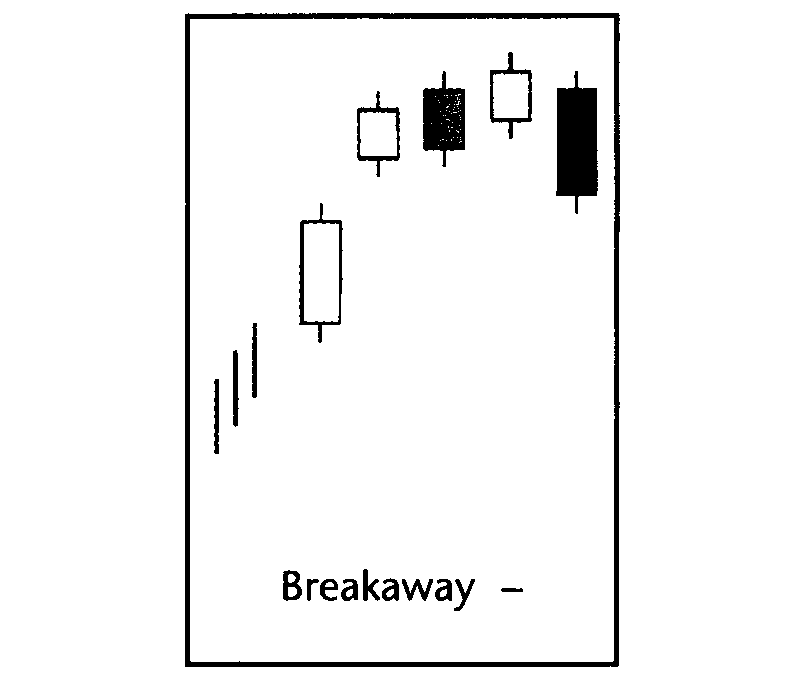
Breakaway Bearish
- Stock should be in a upward trend
- Five day pattern where today is day 5
- Day 1 is a long white candlestick
- Day 2, 3, & 4 are white candlesticks where each day closes above the previous day's close
- Day 5 or today is a long dark candlestick where the close is within Day 1 open and close
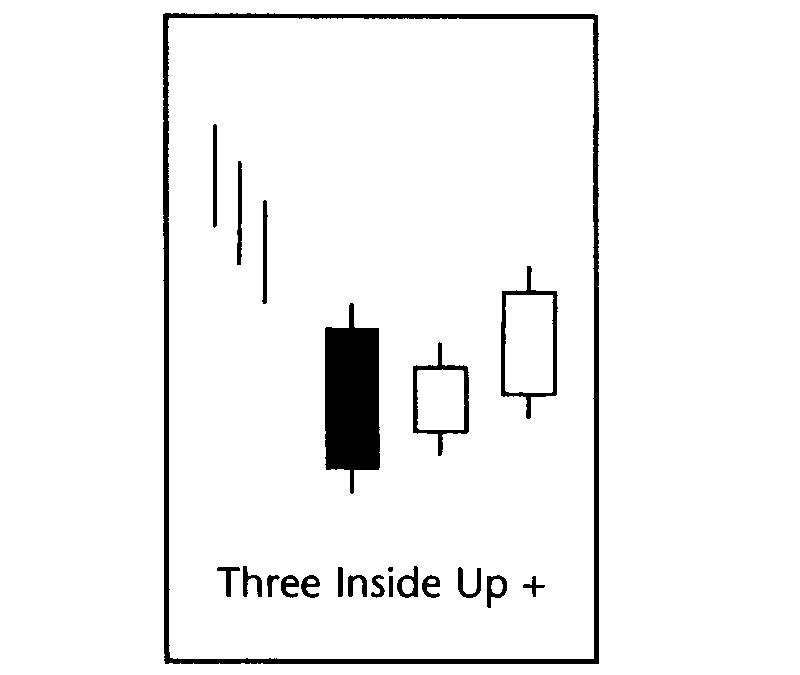
Three Inside Up Bullish
- Stock should be in a downward trend
- Three day pattern where today is day 3
- Day 1 is a long dark candlestick
- Day 2 or yesterday is a white candlestick and engulfed by Day 1's body
- Day 3 or today is a white candlestick where the close is above day 2 open
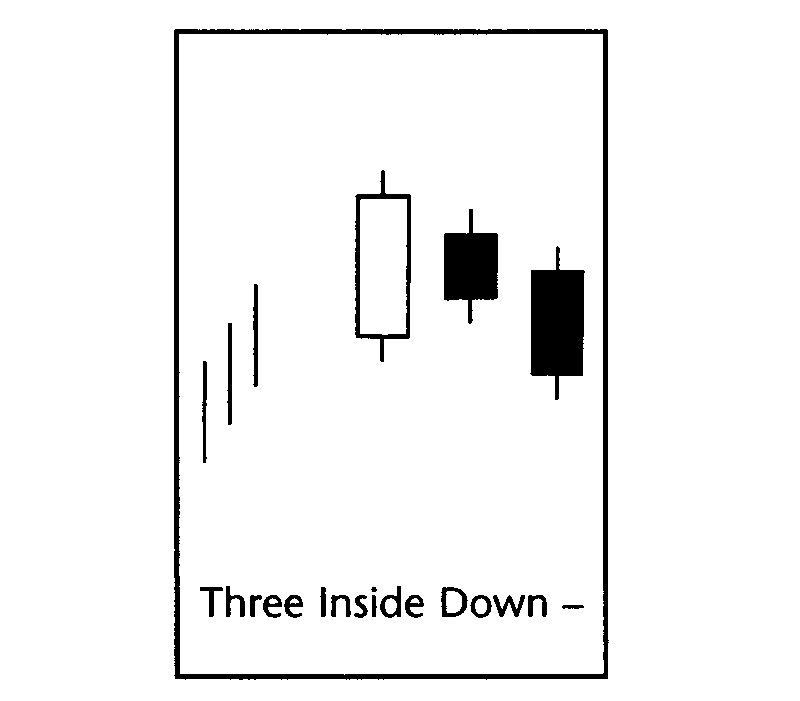
Three Inside Down Bearish
- Stock should be in a upward trend
- Three day pattern where today is day 3
- Day 1 is a long white candlestick
- Day 2 or yesterday is a dark candlestick and engulfed by Day 1's body
- Day 3 or today is a dark candlestick where the close is below day 2 open
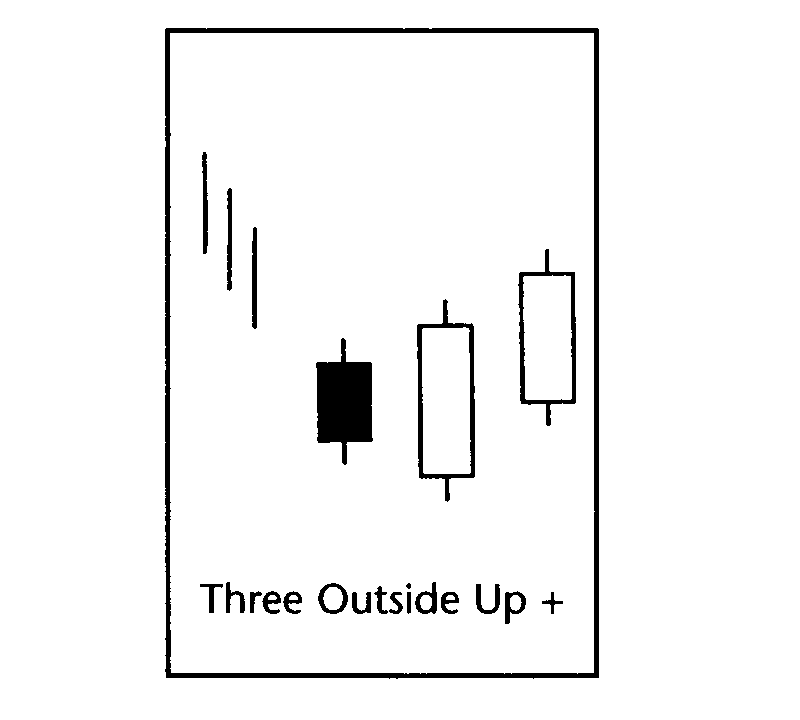
Three Outside Up Bullish
- Stock should be in a downward trend
- Three day pattern where today is day 3
- Day 1 is a dark candlestick
- Day 2 is a long white candlestick that engulfs the body of Day 1 and closes above Day 1 open
- Day 3 or today opens above Day 2 open and closes above day 2 close
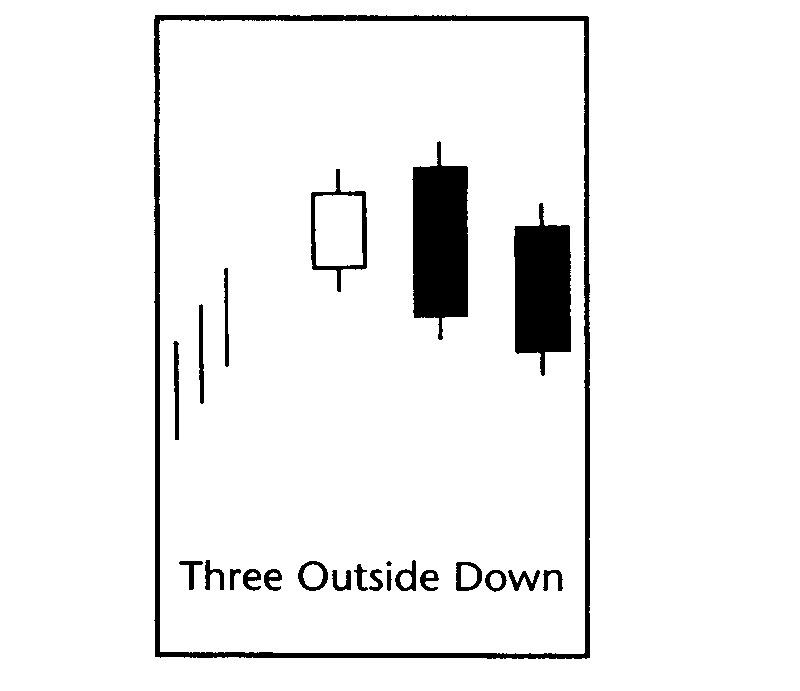
Three Outside Down Bearish
- Stock should be in a upward trend
- Three day pattern where today is day 3
- Day 1 is a white candlestick
- Day 2 is a long dark candlestick that engulfs the body of Day 1 and closes below Day 1 open
- Day 3 or today opens below Day 2 open and closes below day 2 close
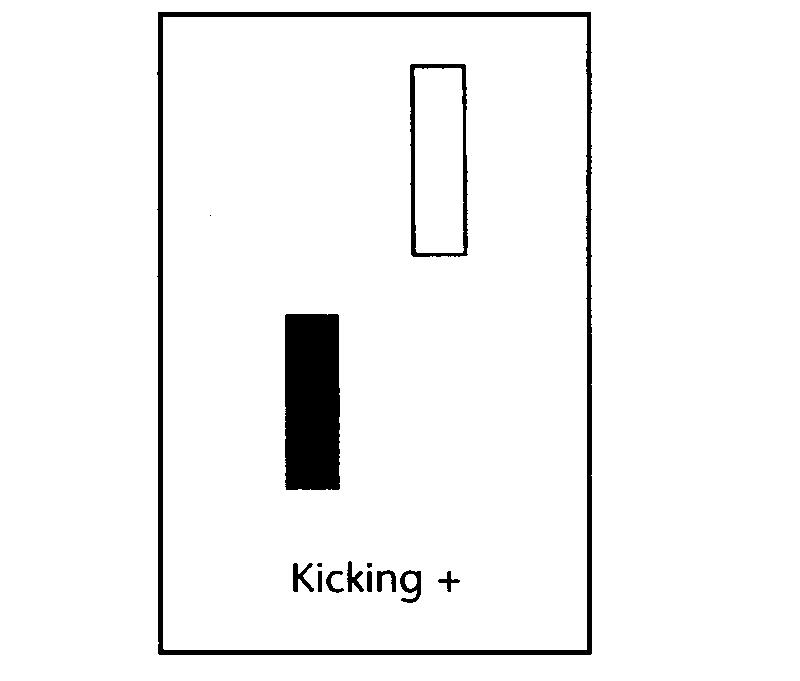
Kicking Bullish
- Yesterday is a dark candlestick
- Today is a white candlestick which gaps and opens above yesterday's high
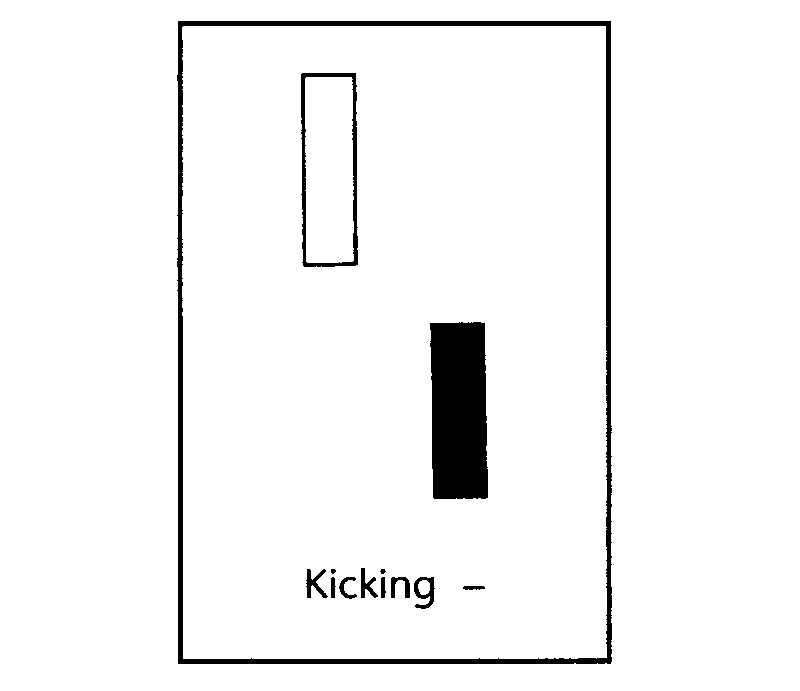
Kicking Bearish
- Yesterday is a white candlestick
- Today is a dark candlestick which gaps and opens below yesterday's low
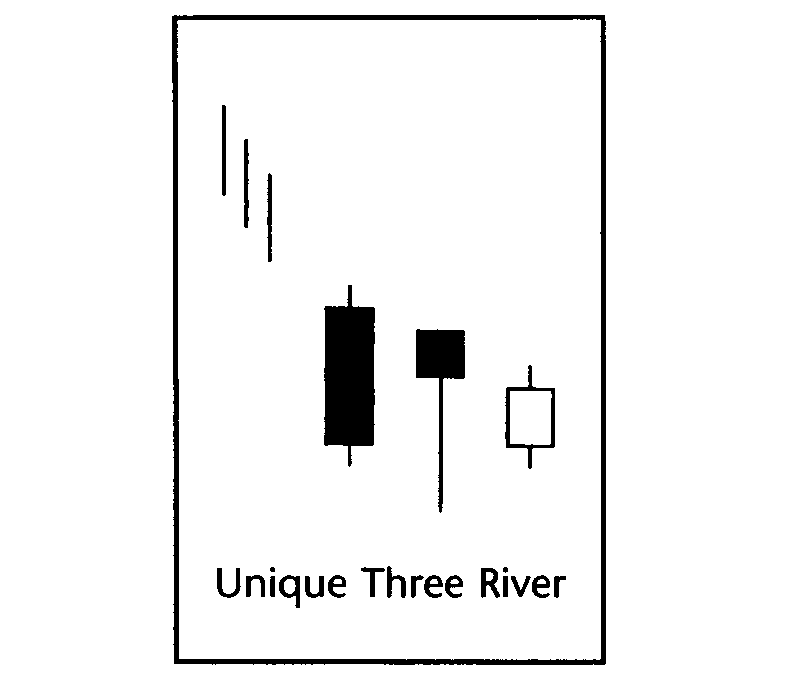
Unique Three River Bullish
- Stock should be in a downward trend
- Three day pattern where today is Day 3
- Day 1 is a long dark candlestick
- Day 2 or yesterday is a dark candlestick
- Day 2 or yesterday low is lower than Day 1
- Day 3 or today is a white candlestick but closes below yesterday's close
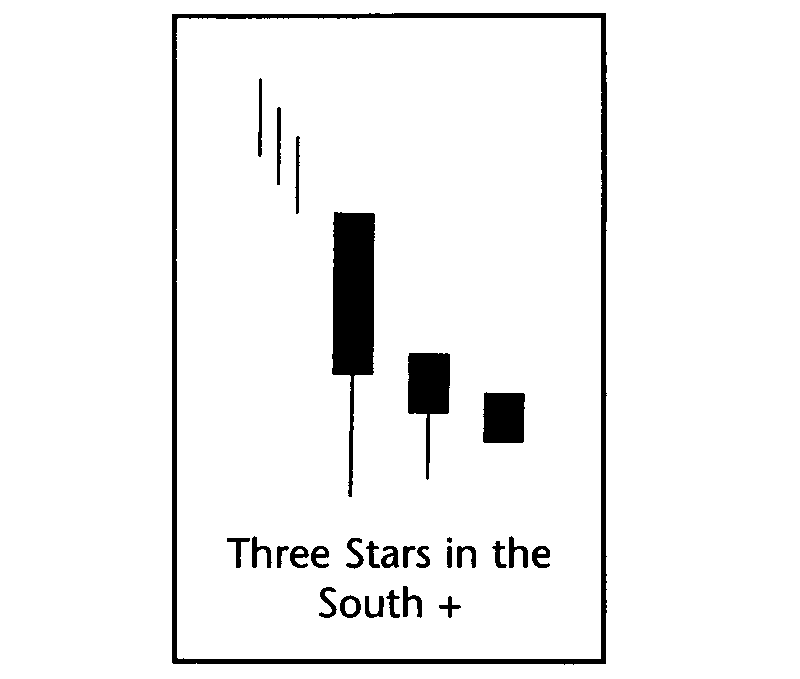
Three Stars Bullish
- Stock should be in a downward trend
- Three day pattern where today is Day 3
- Day 3 is a long dark candlestick with a long lower wick or shadow
- Day 2 or yesterday is a dark candlestick where the open is below Day 3 open and close is below Day 3 close
- Day 1 or today is a dark candlestick where high and low are within Day 2 high and low
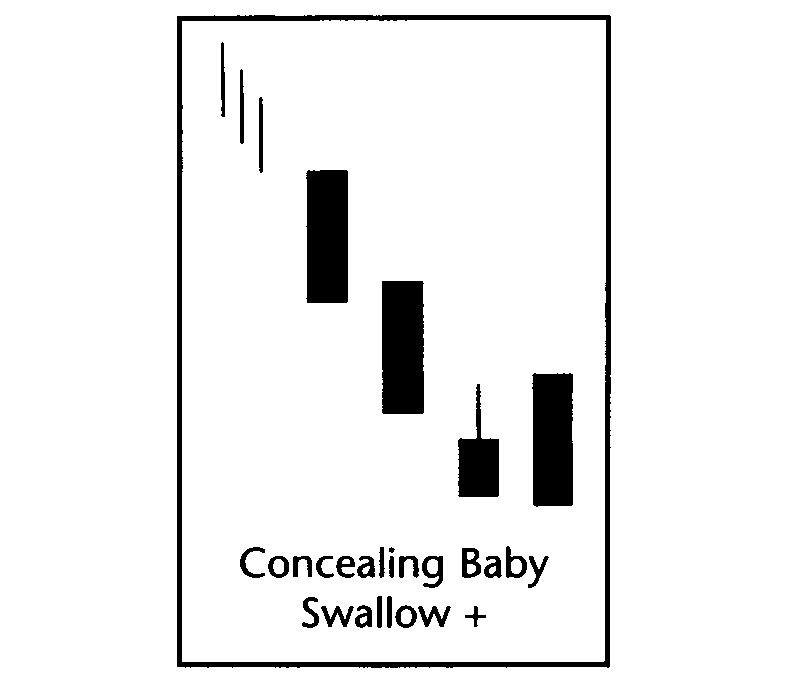
Concealing Swallow Bullish
- Stock should be in a downward trend
- Four day pattern where today is Day 4
- Day 1 and Day 2 are long dark candlesticks
- Day 3 or yesterday is a dark candlestick that opens below Day 2 low
- Day 3 or yesterday high is within Day 2 open and close
- Day 4 or today is a long dark candlestick that engulfs Day 3 or Yesterday
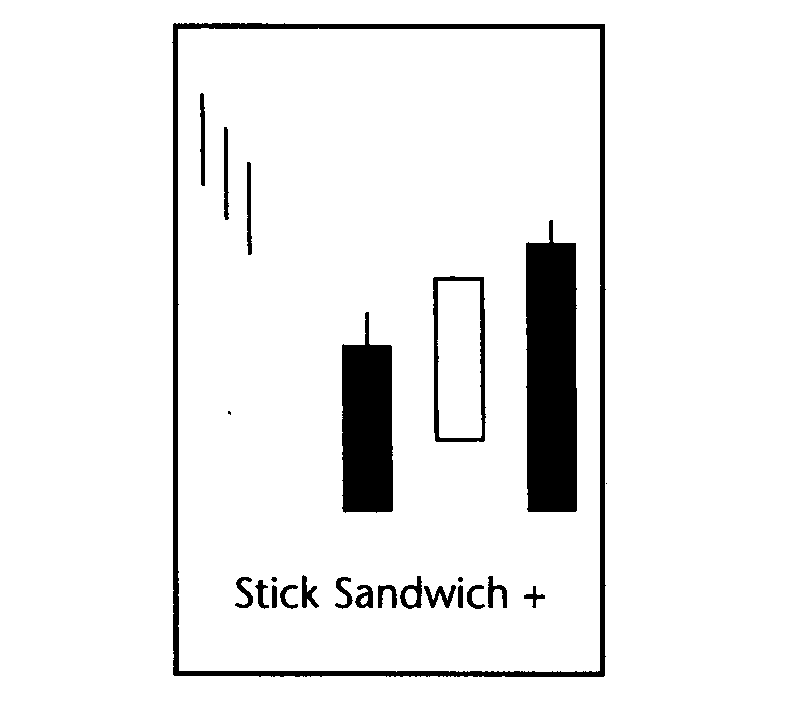
Stick Sandwich Bullish
- Stock should be in a downward trend
- Three day pattern where today is Day 3
- Day 1 is a long dark candlestick
- Day 2 open and close is between Day 3 open and close
- Day 3 or today is a dark candlestick that closes near Day 1's close
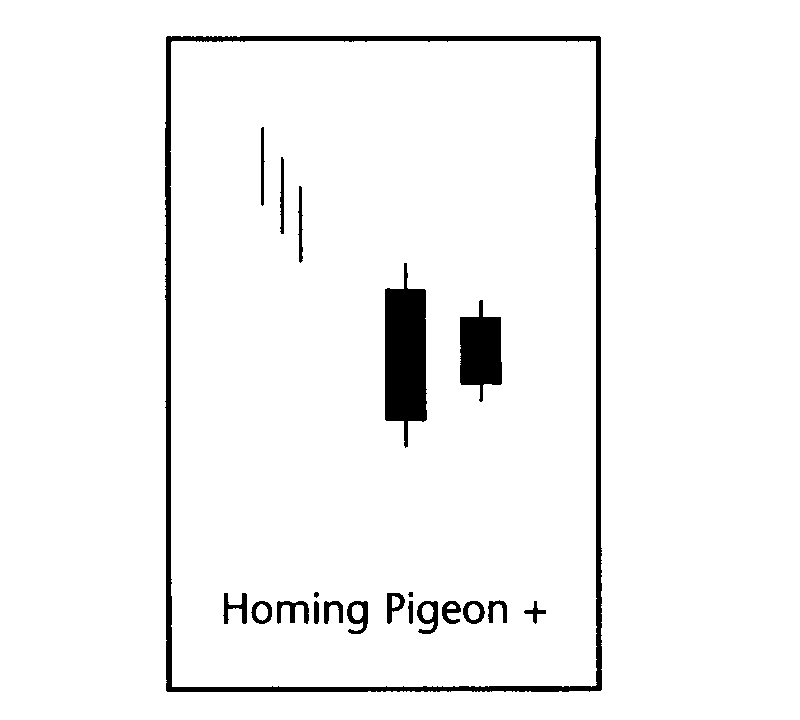
Homing Pigeon Bullish
- Stock should be in a downward trend
- Yesterday is a long dark candlestick
- Today is a dark candlestick
- Today's open and close are within yesterday's open and close
Ladder Bottom Bullish
- Stock should be in a downward trend
- Five day pattern where today is Day 5
- Day 1, Day 2, Day 3 are dark candlesticks
- Day 2 close is lower than Day 1 close
- Day 3 close is lower than Day 2 close
- Day 4 close is lower than Day 3 close with long upper wick or shadow
- Day 5 or today is a white candlestick that opens above Day 4 open
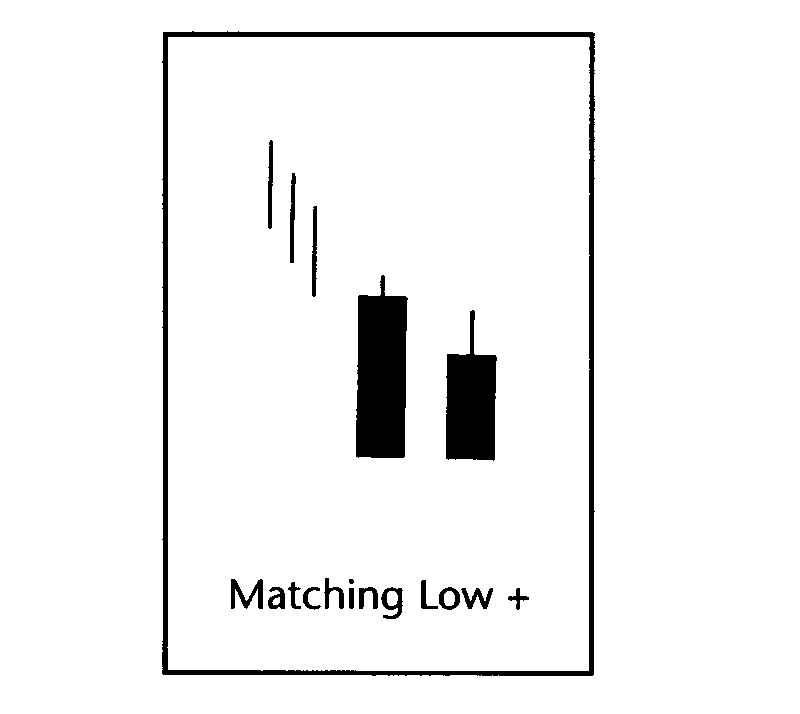
Matching Low Bullish
- Stock should be in a downward trend
- Yesterday is a long dark candlestick
- Today is a dark candlestick and the close is near or equal to yesterday's close
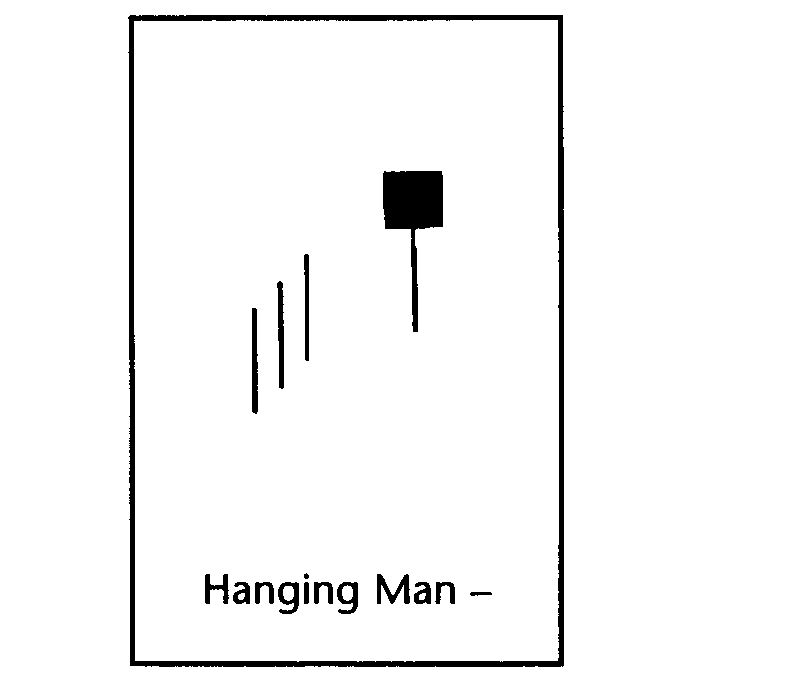
Hanging Man Bearish
- Stock should be in a upward trend
- Today is a dark or white candlestick
- Today's lower shadow or wick is at least twice the length of the open and high
- Today's upper shadow is little or none
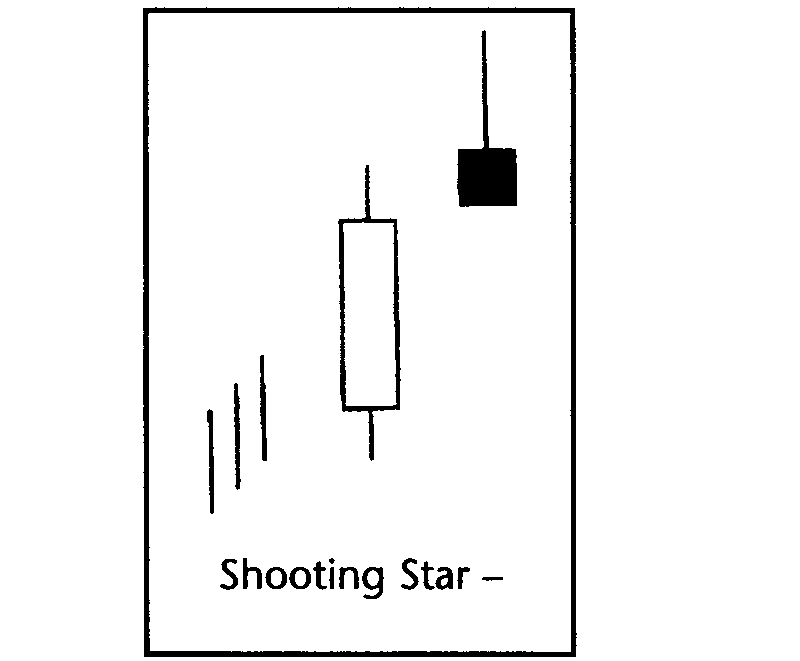
Shooting Star Bearish
- Stock should be in a upward trend
- Yesterday is a long white candlestick
- Today is a small body (open and close)
- Today has a long upper wick or shadow
- Today has little or no lower shadow
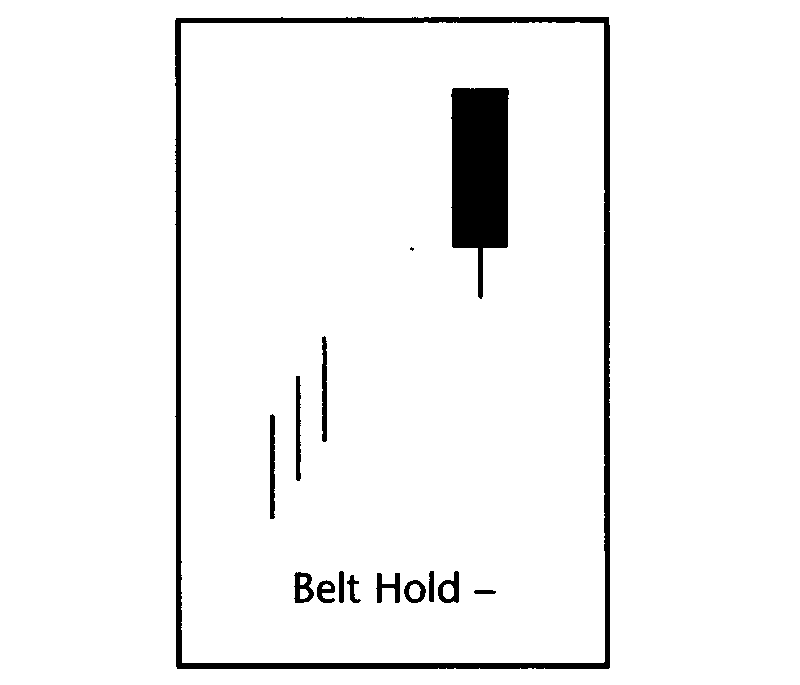
Belt Hold Bearish
- Stock should be in a upward trend
- Yesterday is a white candlestick
- Today is a long dark candlestick
- Today has little or no upper wick or shadow
- Today has short lower shadow
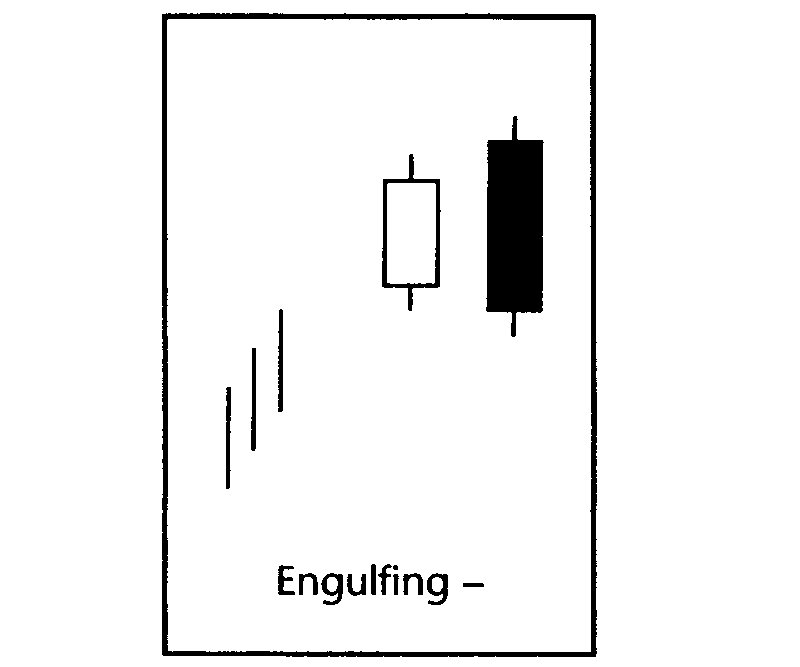
Engulfing Bearish
- Stock should be in a upward trend
- Yesterday is a white candlestick
- Today is a long dark candlestick
- Today engulfs yesterday's high and low range
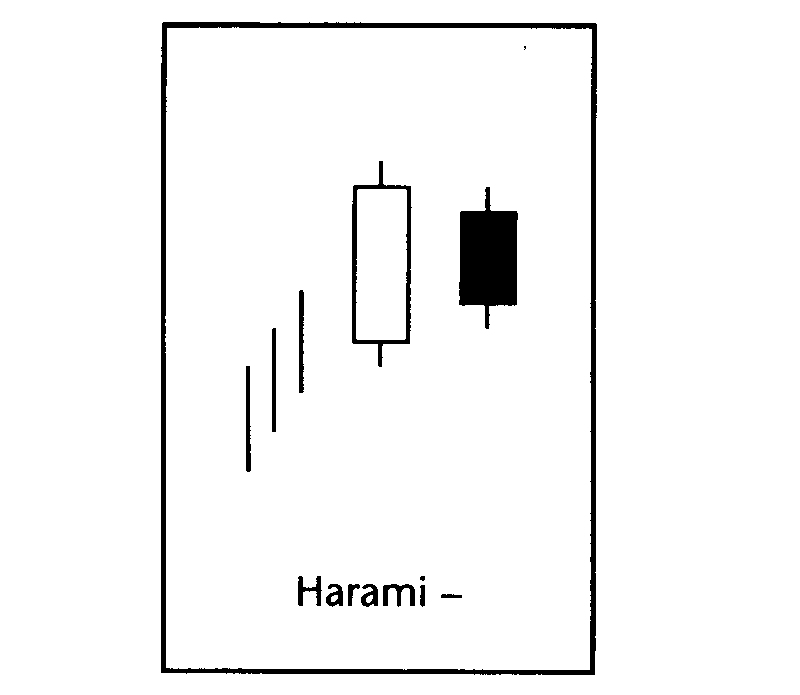
Harami Bearish
- Stock should be in a upward trend
- Yesterday is a long white candlestick
- Today is a small dark candlestick
- Yesterday's body completely engulfs today's body
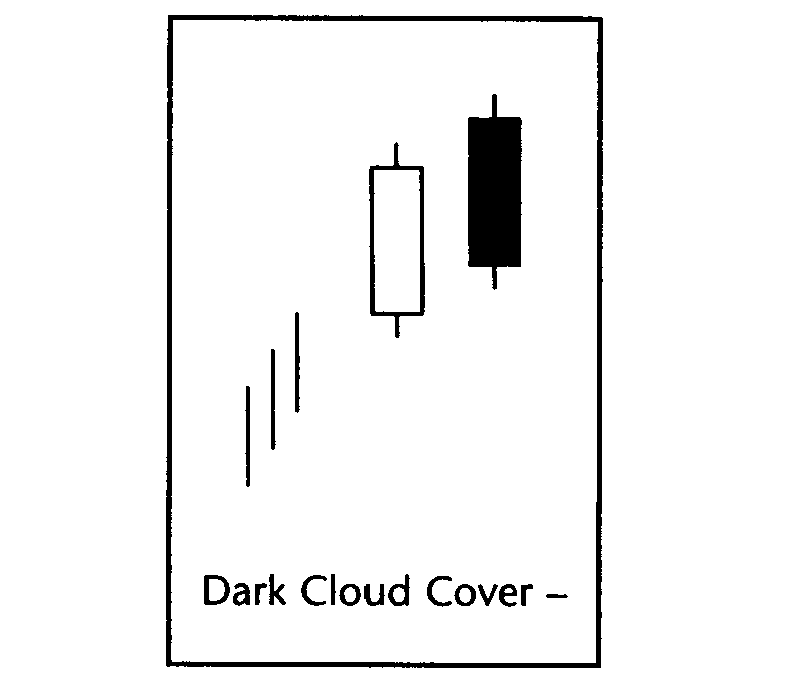
Dark Cloud Bearish
- Stock should be in a upward trend
- Yesterday is a long white candlestick
- Today is a long dark candlestick
- Today's open is above yesterday's high
- Today's close is near the mid point of yesterday's open and close
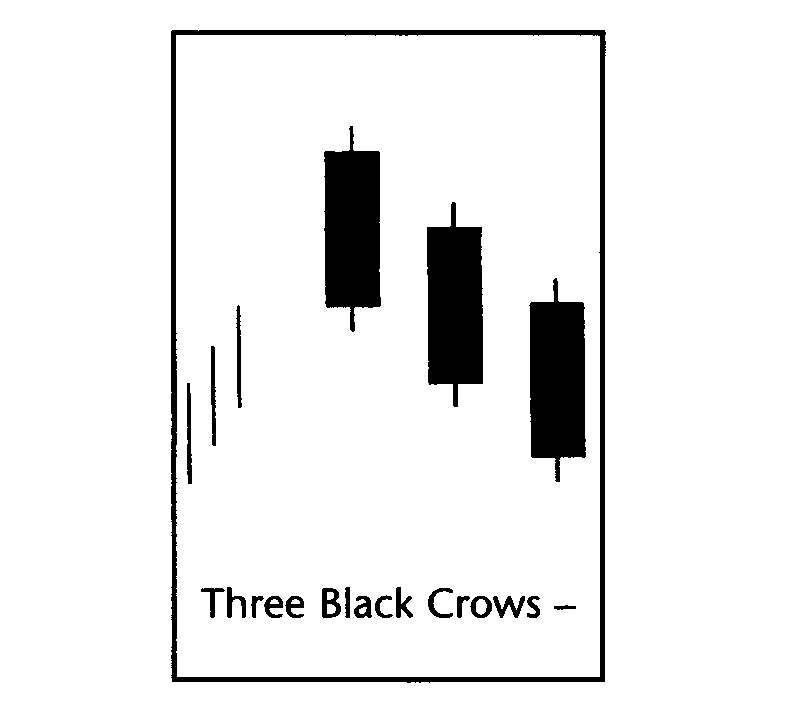
Three Black Crows Bearish
- Stock should be in a upward trend
- Three day pattern where today is Day 3
- Day 1, Day 2 & Day 3 are dark candlesticks
- Day 2 opens within previous open and close
- Day 3 opens within previous open and close
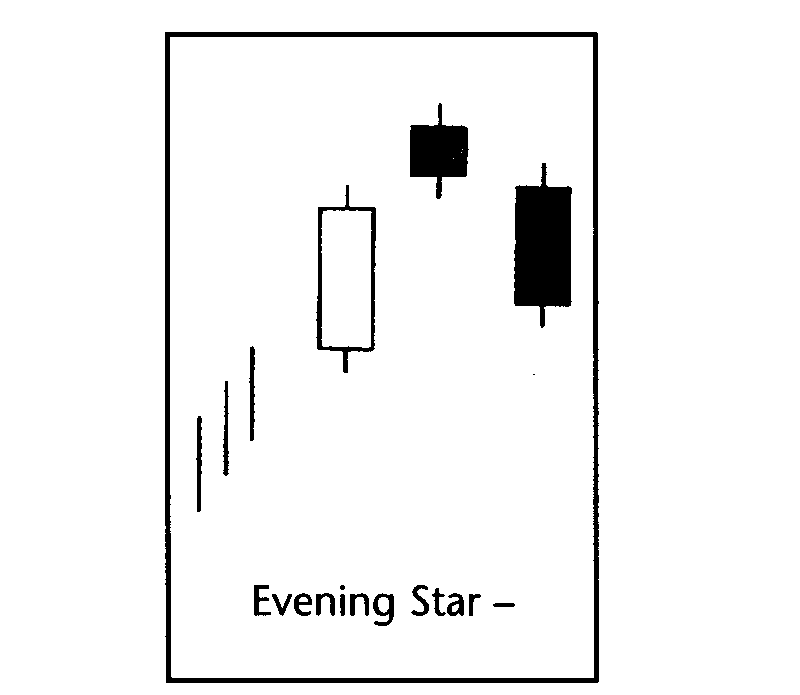
Evening Star Bearish
- Stock should be in a upward trend
- Three day pattern where today is Day 3
- Day 1 is a long white candlestick
- Day 2 is a small dark or white candlestick which closes above Day 1 close
- Day 3 or today is a long dark candlestick
- Day 3 opens near or below Day 2 close and closes below Day 2 close
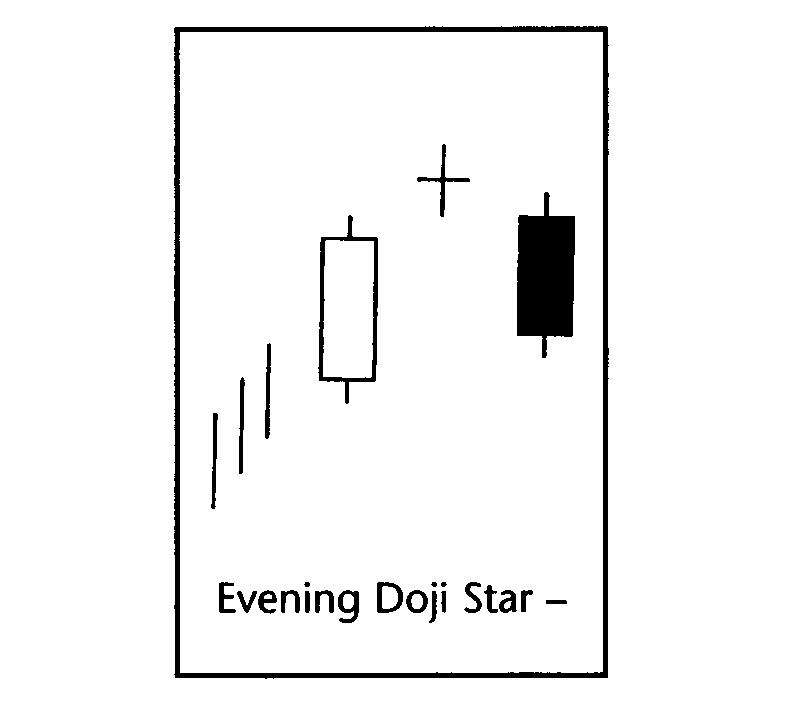
Evening Doji Star Bearish
- Stock should be in a upward trend
- Three day pattern where today is Day 3
- Day 1 is a long white candlestick
- Day 2 is a Doji Star where open and close are same
- Day 2 close is higher or equal to Day 1 close
- Day 3 or today is a dark candlestick
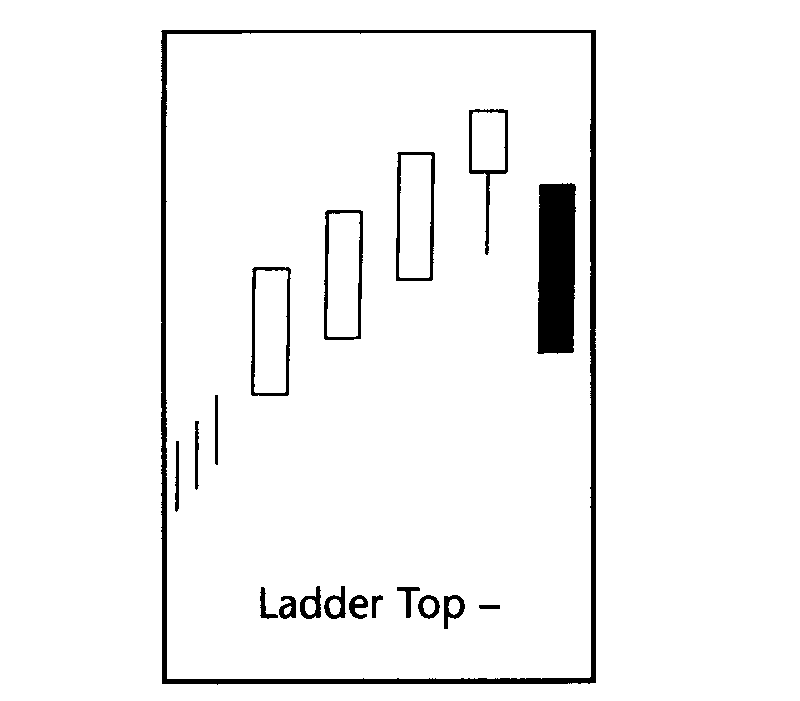
Ladder Top Bearish
- Stock should be in a upward trend
- Five day pattern where today is Day 5
- Day 1, Day 2, & Day 3 are long white candlesticks
- Day 4 is a white candlestick with long wick or shadow
- Day 5 or today is a dark candlestick
- Day 5 or today opens below the Day 4's open
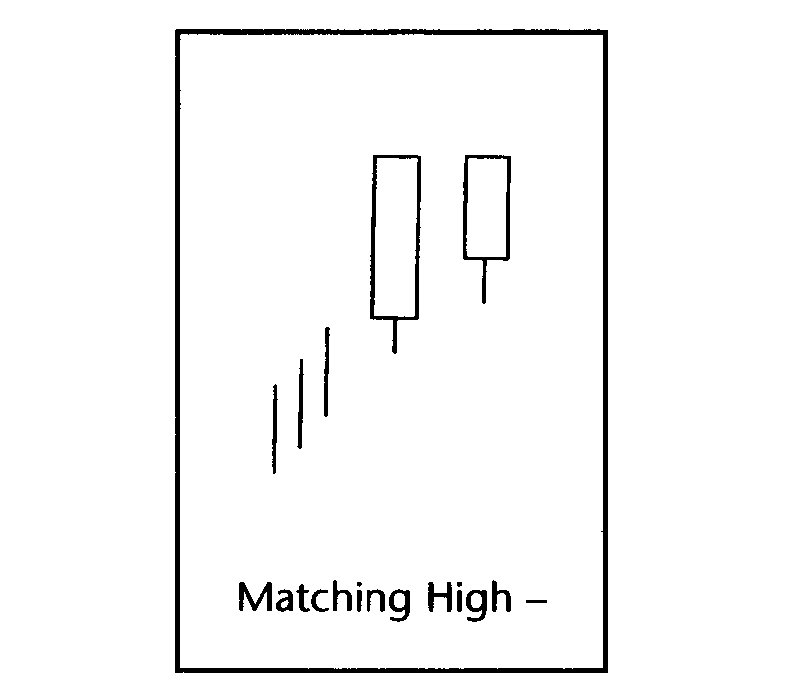
Matching High Bearish
- Stock should be in a upward trend
- Yesterday is a long white candlestick
- Today is a white candlestick
- Today's close is the same as yesterday's close
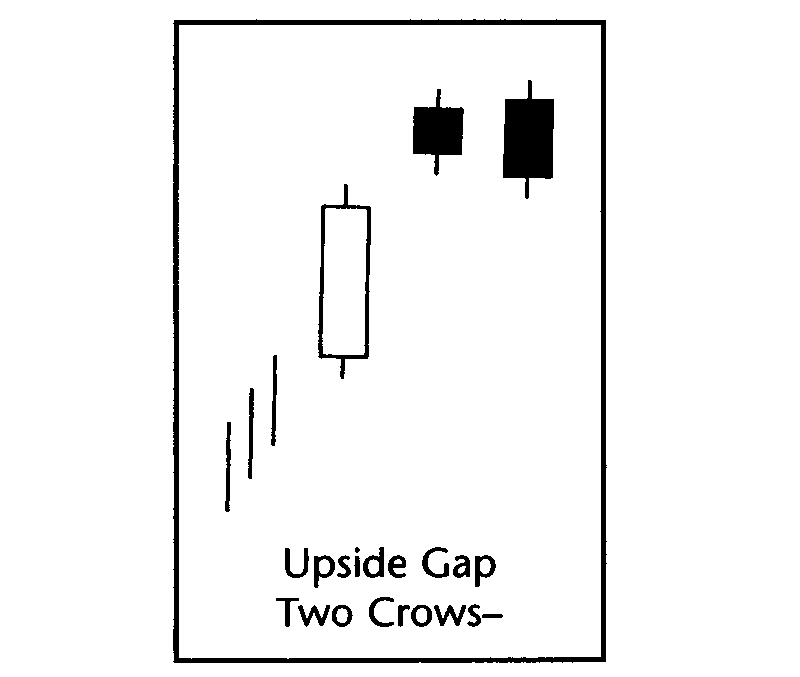
Upside Gap Two Crows Bearish
- Stock should be in a upward trend
- Three day pattern where today is Day 3
- Day 1 is a long white candlestick
- Day 2 is a short dark candlestick that closes above Day 1's high
- Today is a dark candlestick that engulfs Day 2's open and close
- Today's close is below yesterday's close
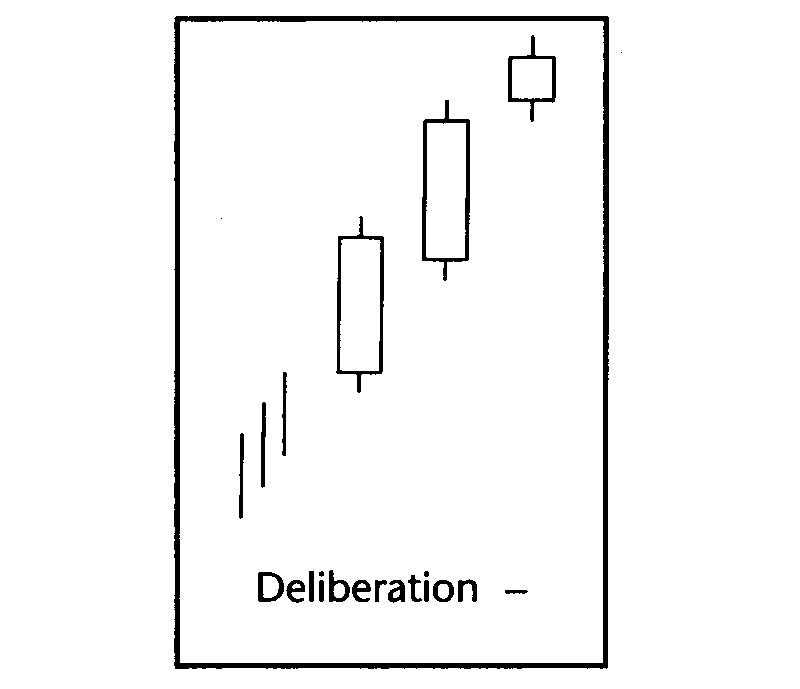
Deliberation Bearish
- Stock should be in a upward trend
- Three day pattern where today is Day 3
- Day 1 is a long white candlestick
- Day 2 is a long white candlestick that opens within Day 1's open and close
- Day 3 or today is a white candlestick that opens above the close of Day 2
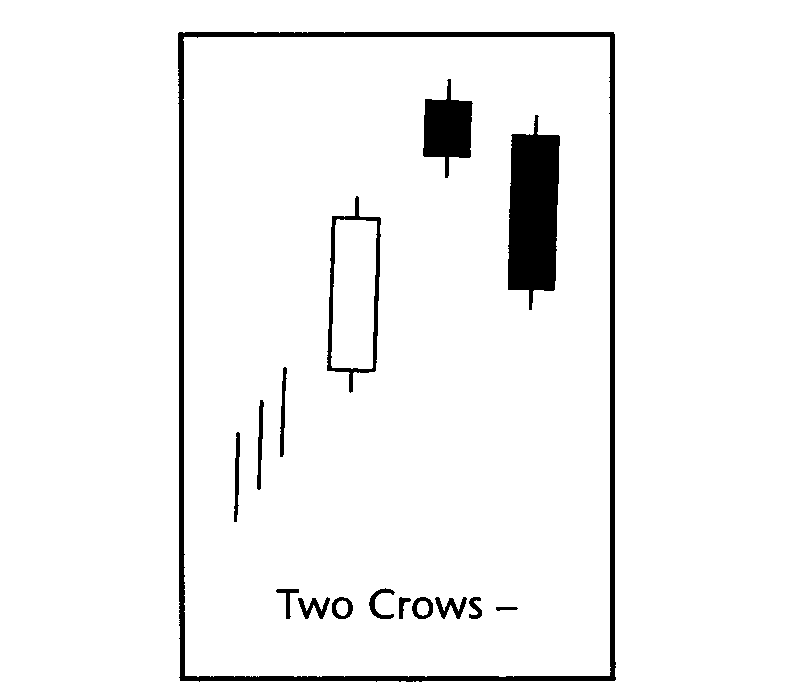
Two Crows Bearish
- Stock should be in a upward trend
- Three day pattern where today is Day 3
- Day 1 is a long white candlestick
- Day 2 is a dark candlestick
- Day 2 opens and closes above Day 1's high
- Day 3 or today opens within the Day 2's open and close
- Day 3 or today closes within the Day 1's open and close
Doji Star Bearish
- The market is characterized by a prevailing uptrend
- On the first day a white candlestick is observed
- Then, we see a Doji on the second day that gaps up